Monthly Newsletter – September 2021
A summary of key events and market trends during the month of September
- Markets in September paused to take a breath
- Multiple factors including re-accelerating inflation, the sticky US debt ceiling negotiations and yet-to-be-delivered infrastructure spending, continuing regulatory action in China have led to short-term nervousness
- We continue to see these impacts as temporary negatives to the market and expect easy monetary and fiscal policy over the coming quarters
- The Volatility Index (VIX) closed over the 20 level for the first time in seven months in line with the sell-off in risk assets
Global markets take a breather…
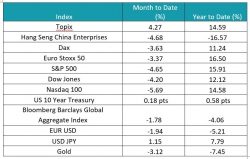
Apart from Japan’s Topix most equity indices traded lower for the month
Key Markets
Recap of the month …
At its latest meeting the Federal Reserve further inched toward a potential tapering of its asset purchases, while not fully conveying the same either. The next few meetings, three in coming four months, could see the start of the process and with bond purchases being completely phased out by the second or third quarter of 2022.
To recapitulate the timelines since 2000 of the Federal Reserve’s balance sheet growth, taper, and then, again, growth processes:
- January 2000 – Federal Reserve balance sheet stood at USD 600 billion and mainly accounted for cash in circulation and similar.
- August 2008 (pre-Lehman) – This gradually grows to USD 900 billion at an average pace of USD 35 billion per annum and broadly reflects the overall growth in the economy.
- September 2008 – October 2014 – Various rounds of quantitative easing commence and the balance sheet grows to USD 4.50 trillion – this is 5 times larger over the course of the six-year period and represents an average pace of USD 600 billion per annum.
- November 2014 – December 2017 – the size of the Feds balance sheet has remained broadly static over the intervening three-year period and represents the cessation of new bond buying and the reinvestment of the proceeds of maturing bonds. Along the way, in December 2015, the Fed hikes interest rates to a range of 0.25 – 0.50 % and reaches a level of 1.25 – 1.50 % by December 2017.
- January 2018 – August 2019 – the Fed gradually reduces the size of its balance sheet by not reinvesting the proceeds of maturing bonds and the balance sheet stands at USD 3.75 trillion at this point. This represents a shrinking of the balance sheet by around USD 450 billion per annum. Interest rates keep increasing and reach a high of 2.25 – 2.50 % in December 2018 and after holding steady for a few months are then reduced to 1.75 – 2.00 % by August 2019.
- September 2019 – February 2020 – a confluence of events including the US / China trade-war, reduced US tax receipts on the back of the Trump administration’s tax cuts and continued heavy borrowing by the US Treasury to fund current spending plans as well as restrictions on the flexibility of banks’ balance sheets came to a head this month and forced overnight interest rates to spike to close to 10 %. In response the Federal Reserve restarted bond purchases while at the same time firmly stating that this didn’t represent a new round of quantitative easing. The net impact of its policies led the balance sheet to grow to USD 4.15 trillion over this six-month period at an average annualized pace of USD 800 billion. Interest rates continue their decline and reach 1.50 – 1.75 % by February 2020.
- March 2020 onwards – COVID 19 strikes and global supply chains stall, leading, in turn, to the global payments system to stall too. This puts unprecedented pressure on governments and corporates to make USD payments and leads them to sell their holdings of US Treasury paper. The speed and size of this reaction forces the most liquid of global markets, that of the market for US Government bonds, to freeze and in turn precipitates a collapse in prices across all asset classes. The Federal Reserve steps in with a fresh round of government bond purchases, the size of which makes the previous rounds pale in comparison. As of now the balance sheet stands at USD 8.45 trillion; this is more than twice the size of the level in February 2020 and represents annualized growth of around USD 2.70 trillion. Interest rates are dropped to the lower bound of 0.00 – 0.25 % in March 2020 and have stayed at that level since.
Having painted this backdrop we feel it is instructive to view the performance of the US equity markets from November 2014 to August 2019 – a period initially of no balance sheet growth, and then of interest rate hikes as well as balance sheet reduction. During this period the S&P 500 grew at an annualized rate of 10 % and the Nasdaq 100 doing better at around 15 %.
As the Federal Reserve continues to be currently only talking about tapering its asset purchases we feel we are some time away from restrictive monetary conditions. As such, and notwithstanding the occasional correction we expect continued support for equity assets which provide the potential for appreciation and to counter the inflationary impact of said policies. We also like to have some exposure to precious metals as a hedge to the impact of global monetary expansion.
In Japan there appears to be more demand for further monetary easing with a new Prime Minister stepping in and the need felt to counter the impact of the multiple lockdowns. Germany, too, sees a change of guard but likely with less of an impact to the ECB’s monetary policies.
The news of Merck’s COVID cure will be eagerly followed in the coming weeks with implications for allocations across sectors and geographies.
The US Dollar strengthened for the month and we expect it to weaken in the coming months as investors realize the Fed will likely proceed very gradually with the taper of its bond purchases.
Volatility while higher than the last six months continues to be closer to the lower end of longer-term ranges. We have been taking advantage of the spikes in volatility by investing in structured products that benefit from the same and will gradually build allocations here.